


EV Charging RMS: What You Need to Know
.webp)
As recent disruptions in the Strait of Hormuz push crude oil prices past the 100 USD a barrel, energy security has become a critical vulnerability. For India, which imports nearly 90% of its crude oil, these supply shocks mean that the transition away from fossil fuels is not just a climate goal. It is an urgent economic necessity. Thus, the EV industry in the country is proving, yet again, why it has long term strategic value.
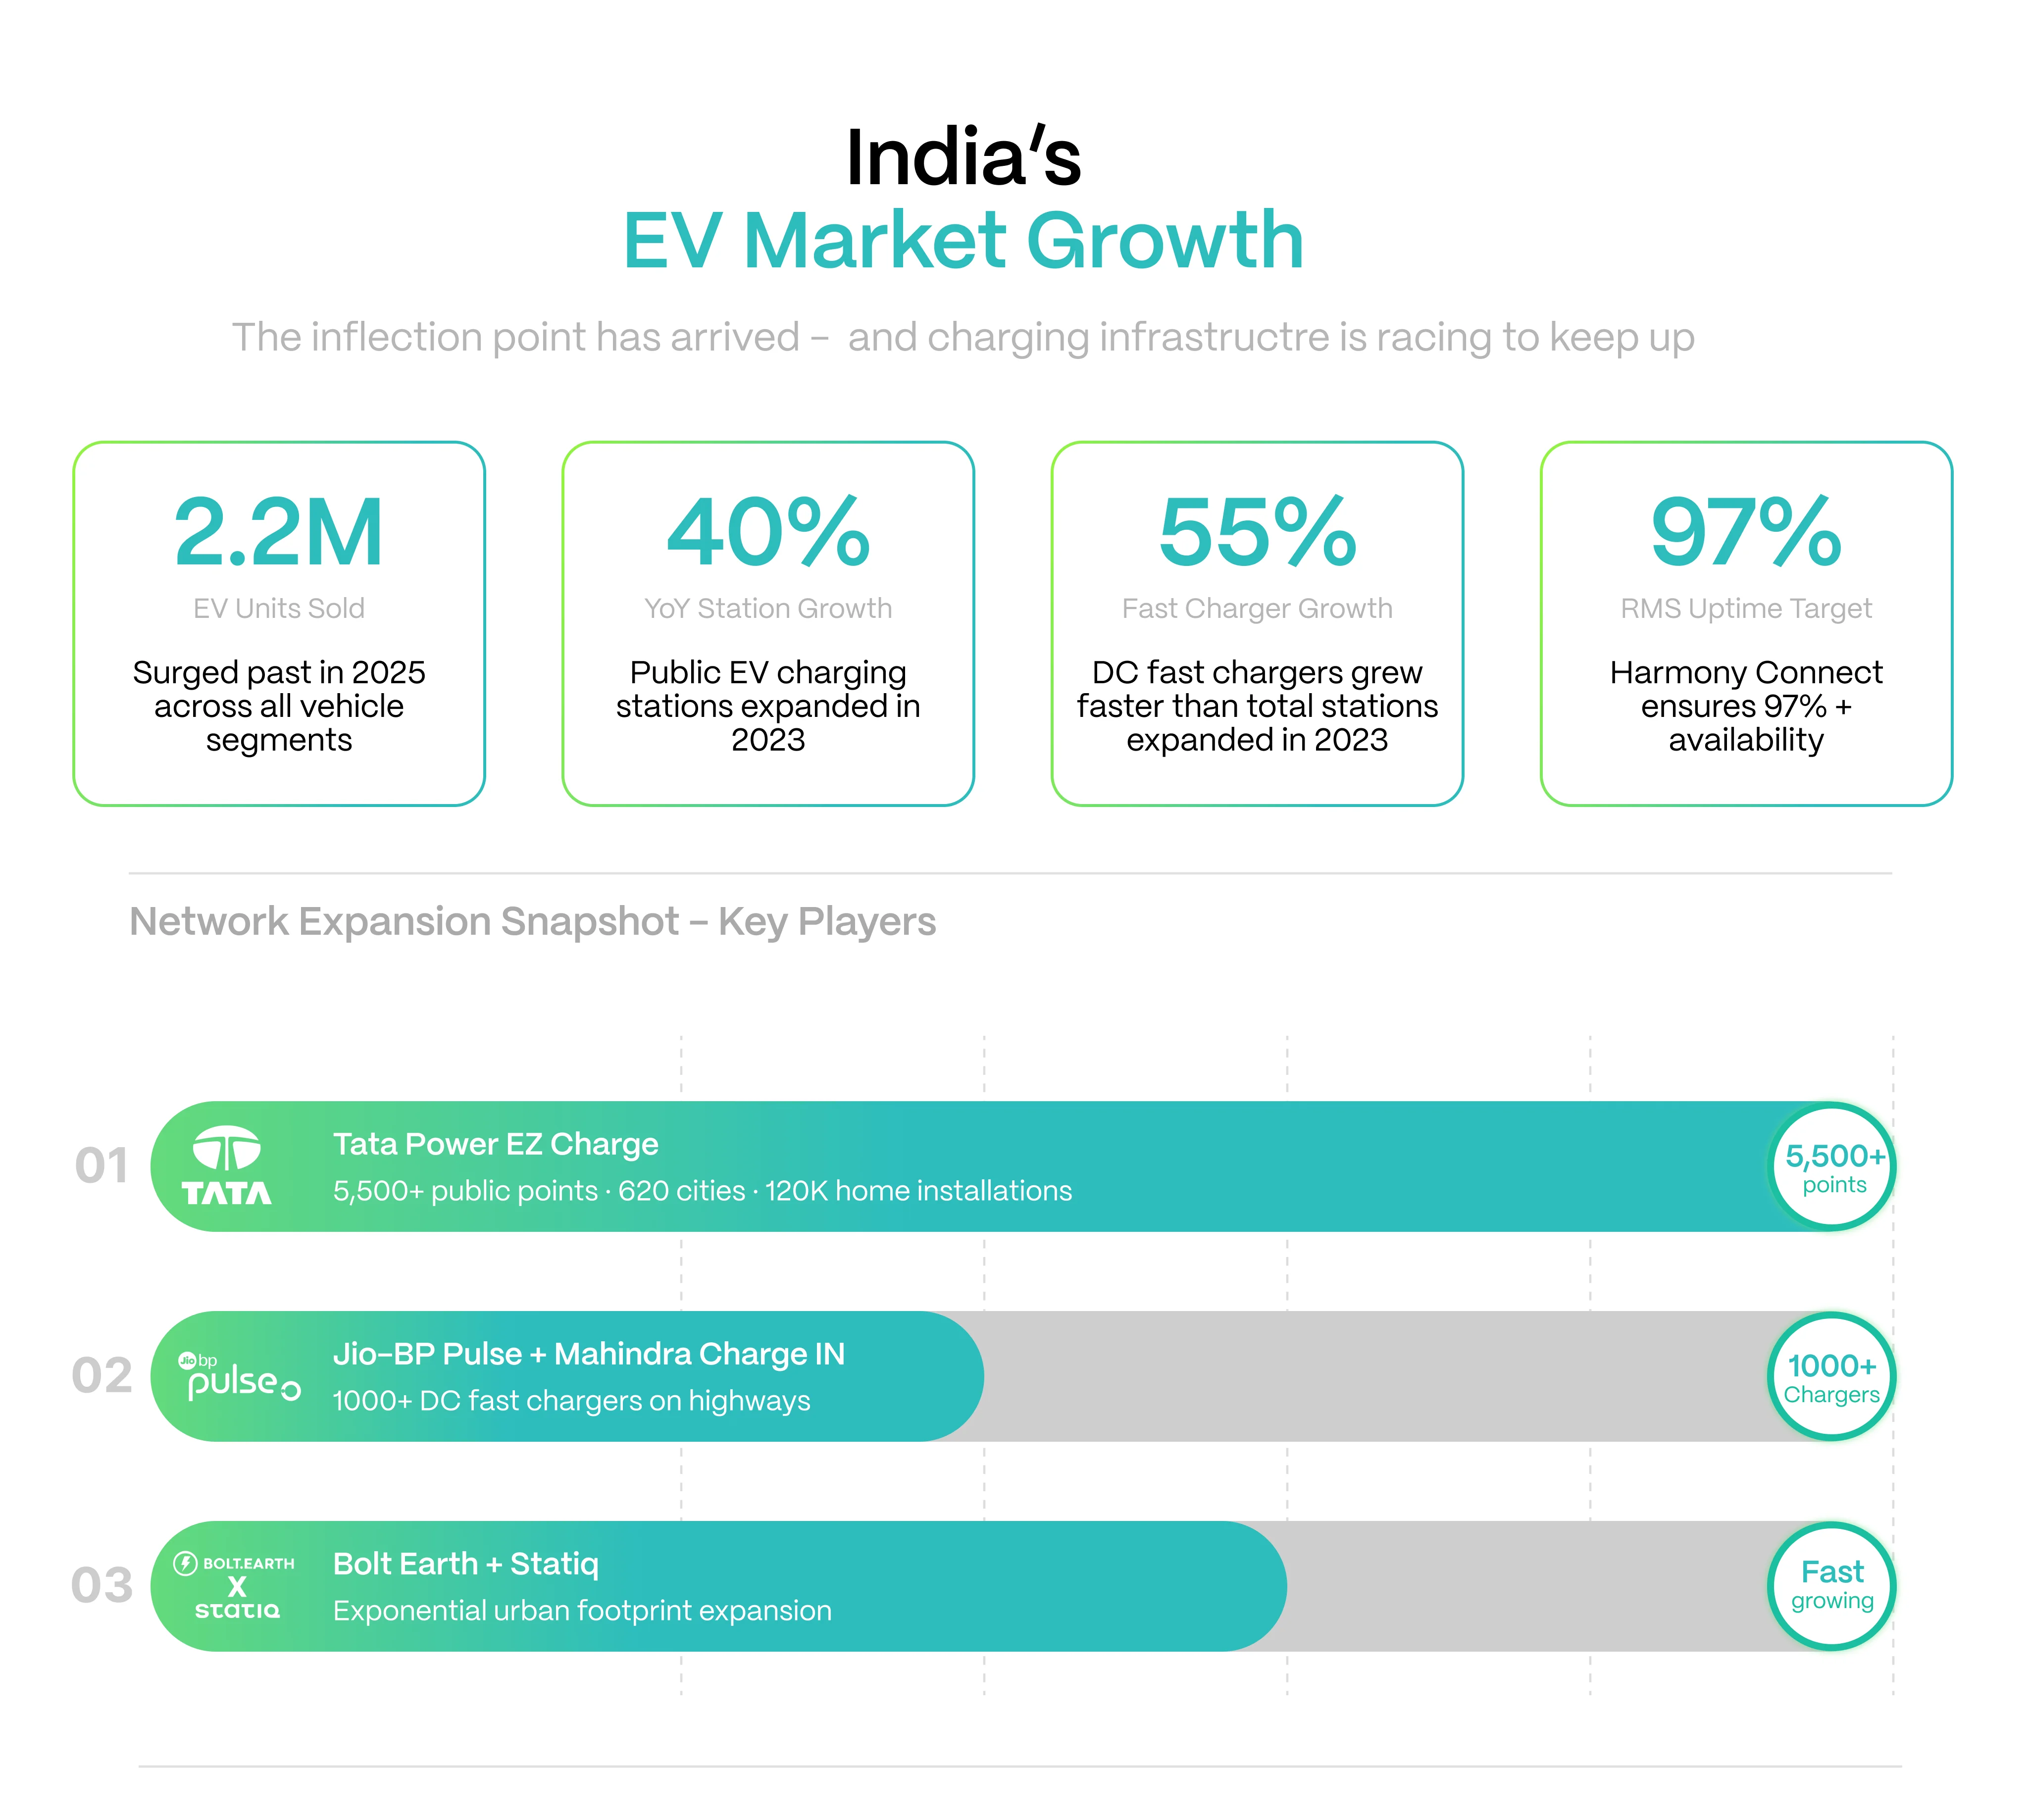
We are standing at a critical inflection point in electric mobility, moving from localized pilot projects into a phase of massive, widespread growth. The domestic market is already responding to this new reality. India's EV sales surged past 2.2 million units in 2025, and early 2026 data show continued momentum in retail sales across vehicle segments. With this surge in demand, we are seeing the EV charging industry grow too, with Charge Point Operators (CPOs) expanding rapidly into complex, multi-city operations.
More players are entering the EV charging market with bigger networks
In 2023, public EV charging stations grew by 40% year-over-year, and fast chargers accelerated even faster at 55%. In India, several domestic players are shaping this transformation.
Tata Power for eg, has has scaled its EZ Charge network to over 5,500 public points across 620 cities, alongside doing 120,000+ home installations. Jio-bp Pulse and Mahindra (Charge_IN) are leading the highway EV charging installations, including over 1000 DC fast chargers. Bolt.Earth and Statiq are also exponentially increasing their footprint, especially in dense urban areas.
Bigger networks cannot be managed with just manual monitoring
When you are managing hundreds of EV charging stations across distributed grids, you cannot afford to wait for a customer to report a failure. Faults do not just happen; they begin as weak digital signals before cascading into full downtime events.
Let me give you a few practical examples of the issues that routinely occur in the field. You might see repeated communication retries that eventually trigger active session drops. We see thermal derating events that, if ignored, escalate into hard, system-wide outages. There are also intermittent connector contact issues that degrade into complete hardware failure, or local grid voltage disturbances that your system misinterprets as broken chargers.
This operational complexity is where a Remote Management System, or RMS, comes in.
Network monitoring issues are largely taken care of by RMS
As we explained in our previous blogs, RMS is a 3 layered technology architecture.
It begins with edge telemetry, where the charger's electronics continuously stream vital status and fault signals. These signals flow through secure communication channels, typically OCPP-based back-ends, into a cloud analytics layer. Here, raw data is transformed into actionable metrics, along with anomaly detection and automated alerting.
What metrics can one see on an EV charging RMS?
To truly command this infrastructure, a CPO must maintain two distinct but parallel pillars of vision:
- Region-wise view for strategic portfolio steering,
- Individual station view for root-cause diagnosis and immediate field action.
Here is what you will track under each pillar:
- Uptime related metrics – for how long your EV chargers were functional
- At the region level, we look at overall Availability (%), total outage hours, and Mean Time To Recovery (MTTR) to immediately flag underperforming areas and chronic recovery delays.
- At the individual station level, we drill down into connector-hour availability, the specific split of downtime reasons, and repeat-fault ratios over 7 and 30 days. This granularity is essential to distinguish a one-off software anomaly from a recurring hardware defect.
- Utilization related metrics – for how long your EV chargers were used to charge vehicles
- Regionally, measuring sessions per connector per day, kWh per connector per day, and peak occupancy allows us to distinguish between a true demand shortage and a reliability shortage.
- Down at the station level, we evaluate session start success rates, dwell time versus actual charging time, and delivered versus rated power. This helps identify specific bottlenecks like app authorization failures, site congestion, or power derating.
- Revenue and other financial metrics - how much cash flow EV charging station generated
- Region-level metrics must track revenue per connector, revenue per site, and tariff realization variance.
- Station-level metrics focus on preventing billing leakage and roaming settlement loss by comparing billable kWh against metered kWh, alongside failed transactions and payment success rates.
- Charger Health metrics – to prevent sudden downtime and costly truck rolls
- Regionally, we monitor fault-family frequencies, thermal stress indexes, and communication quality scores to detect systemic technical debt before mass component failures occur.
- At the station level, predictive maintenance relies on granular health data: temperature excursions, specific communication retries, firmware reboot frequencies, and connector wear trends.
- Damage control and escalation/alarm matrix – for quick resolution of issues
- Regionally, we track SLA breach rates, repeat incident ratios and P1, P2, and P3 queue volumes, which is basically an automated escalation and alarm matrix:
- P1: Immediate network operations response and dispatch for site-down events, safety triggers, or payment outages.
- P2: Same-day diagnostics for issues like power derating, intermittent failures, or frequent communication drops.
- P3: Batched execution for non-critical anomalies and preventive maintenance flags.
- At the individual station, we monitor time-in-state per alert, first-time-fix rates, and repeat truck-roll ratios to improve recovery speed.
- Regionally, we track SLA breach rates, repeat incident ratios and P1, P2, and P3 queue volumes, which is basically an automated escalation and alarm matrix:
But, let us ground these technological capabilities in economic reality. How much ROI does the RMS generate for a CPO?
In 3 years the RMS generates/saves you ₹1.1 crore in net value
Consider a baseline scenario for a mid-sized operator managing 250 connectors (125 dual gun EV chargers). Going by current industry benchmarks, this generally means an annual gross charging revenue of ₹12 crore, an initial uptime of 93%, an annual reactive maintenance cost of ₹1.8 crore, and an annual demand-charge exposure of ₹0.9 crore. The annual cost of the RMS platform and integration is ₹0.75 crore.
By deploying an RMS, we project uptime improves to 96%, maintenance costs drop by 35%, and demand-charge exposure falls by 12%. Here is the mathematical calculation of that annual value creation:
- Revenue recovery from better uptime: ₹12 crore × (0.96 - 0.93) / 0.93 = ₹0.387 crore/year.
- Maintenance savings: ₹1.8 crore × 35% = ₹0.63 crore/year.
- Demand-charge savings: ₹0.9 crore × 12% = ₹0.108 crore/year.
This results in a gross annual benefit of ₹1.125 crore. Subtracting the ₹0.75 crore RMS platform cost, we achieve a net annual benefit of ₹0.375 crore.
Over a 3-year period, this strategic implementation yields approximately ₹1.1 crore in net value.
RMS deployment can be simplified into 4 stages
A focused rollout path is best deployed in stages, which also protects you from too much expense in case something goes wrong
- Days 0 - 30: lock protocol versions, normalize data dictionaries, and align vendor payloads to OCPP expectations
- Days 31 - 60: Define KPI catalog and escalation matrix. Assign owners for P1, P2, and P3 queues.
- Days 61 - 120: Run predictive maintenance pilot on the worst-performing 20% of sites by outage hours
- Days 121 - 180: deploy dynamic load management at high-demand-charge sites and measure before/after savings
Keeping these ground realities in mind, we created Harmony Connect at Exicom. Harmony Connect RMS is an AI-powered, cloud-based platform that provides real-time visibility and advanced diagnostics across your charging network. By utilizing predictive maintenance and remote troubleshooting, the system ensures over 97% uptime while significantly reducing operational costs.
Learn more here.
Frequently Asked Questions
Lorem ipsum dolor sit amet, consectetur adipiscing elit, sed do eiusmod tempor incididunt ut labore et dolore magna aliqua. Ut enim ad minim veniam, quis nostrud exercitation ullamco laboris nisi ut aliquip ex ea commodo consequat. Duis aute irure dolor in reprehenderit in voluptate velit esse.
Lorem ipsum dolor sit amet, consectetur adipiscing elit, sed do eiusmod tempor incididunt ut labore et dolore magna aliqua. Ut enim ad minim veniam, quis nostrud exercitation ullamco laboris nisi ut aliquip ex ea commodo consequat. Duis aute irure dolor in reprehenderit in voluptate velit esse.
Lorem ipsum dolor sit amet, consectetur adipiscing elit, sed do eiusmod tempor incididunt ut labore et dolore magna aliqua. Ut enim ad minim veniam, quis nostrud exercitation ullamco laboris nisi ut aliquip ex ea commodo consequat. Duis aute irure dolor in reprehenderit in voluptate velit esse.
Lorem ipsum dolor sit amet, consectetur adipiscing elit, sed do eiusmod tempor incididunt ut labore et dolore magna aliqua. Ut enim ad minim veniam, quis nostrud exercitation ullamco laboris nisi ut aliquip ex ea commodo consequat. Duis aute irure dolor in reprehenderit in voluptate velit esse.
Lorem ipsum dolor sit amet, consectetur adipiscing elit, sed do eiusmod tempor incididunt ut labore et dolore magna aliqua. Ut enim ad minim veniam, quis nostrud exercitation ullamco laboris nisi ut aliquip ex ea commodo consequat. Duis aute irure dolor in reprehenderit in voluptate velit esse.
.webp)
.webp)