India’s energy infrastructure – Why investments in power generation will not be enough
Oct 28, 2026
Later afternoon in Ankleshwar, Gujarat, a Pharmaceutical API manufacturer faces a glitch in power supply, with when its at peak power utilization. The incoming 11 kV feeder from the state distribution utility(DISCOM)experiences a 14-second voltage sag followed by a momentary grid trip. Within 18 seconds, the two 500 kVA diesel generators (DGs) roar to life and take the load.
Even with this "100% power backup." the 18-second glitch has already done damage. The Programmable Logic Controllers (PLCs) was reset, halting the the chilled-water circulation loop., breaching the thermal threshold in one of the reactors. An entire batch of high-margin API intermediate solidified into hazardous waste.
This led to real costs – nearly ₹20 lakh of raw material was ruined, 14 hours of downtime followed when unproductive labour cleaned waste and flushed out lines. Maintenance was also hit as VFD capacitors were degraded, and annual maintenance budgets had to go up 20%.
This factory faced something that is central to India’s power paradox. Gujarat is a power surplus state, yet micro-outages impacts process industries and causes many hidden costs. When the grid lacks storage and last-mile distribution resilience, generation capacity at the macro level fails to translate into consistent energy supply to commercial and industrial (C&I) operators.
India’s Energy Demand is Growing at an Unprecedented Rate
India’s energy landscape is shifting fundamentally. While national headlines celebrate massive capacity additions in solar and wind, power generation is only half the story. Until the infrastructure for storage and distribution catches up, more power will not ensure operational consistency, reinforcing the need for critical power solutions.
The macro context of India's grid is defined by rapid electrification, but the nature of that demand is changing. According to the Central Electricity Authority’s (CEA) 20th Electric Power Survey (Mid-Term Review) and the National Generation Adequacy Plan, India has exited its historical 4.5–5% linear demand growth trajectory and entered a structural compounding phase at 7.06% CAGR.
Peak electricity demand has risen from 250–270 GW to a projected 366 GW by 2030 (with ICRA estimating an upside scenario touching 400 GW if industrial capex accelerates) and 459 GW by 2035–36. Total annual energy consumption is set to nearly double from 1,694 Billion Units (BU) to 3,365 BU by 2035–36.
New Demand Sources and Renewable energy drives the Power Electricity Industry
Continuous Process Manufacturing & PLI Industrialization (+85 to 110 GW by 2035): Stimulated by Production-Linked Incentive (PLI) schemes across specialty chemicals, semiconductors, solar wafer/ingot manufacturing, and pharmaceuticals. Unlike legacy batch workshops, modern automated factories require uninterrupted, flat-line 24/7 power with strict IEEE-519 harmonic compliance.
Hyperscale Data Centers & AI Compute (+50 GW by 2030; ~75 GW by 2035): CEA and CRISIL models project over 50 GW of dedicated data center load coming online by 2030 across Mumbai, Chennai, Hyderabad, and NCR—demanding 99.999% uptime and massive continuous cooling loads.
Green Hydrogen Electrolyzers (+50 to 60 GW by 2030–35): To hit the National Green Hydrogen Mission target of 5 MMTPA, electrolyzer banks will draw 50–60 GW of dedicated load, adding over 125 BU of electricity demand that must be matched with round-the-clock power.
EV Fleet Electrification & Space Cooling (+80–100 TWh by 2030): Rapid electrification of commercial logistics fleets, public transit buses, and residential air-conditioning (adding the urban population equivalent of Australia every 24 months) is creating steep, uncoordinated evening demand spikes between 6:00 PM and 11:00 PM.
New Power Plant Plans: The Central Electricity Authority (CEA) projects electricity demand to increase 1.8 times between 2021-22 and 2031-32. India targets adding 472 GW of capacity by 2032. 1
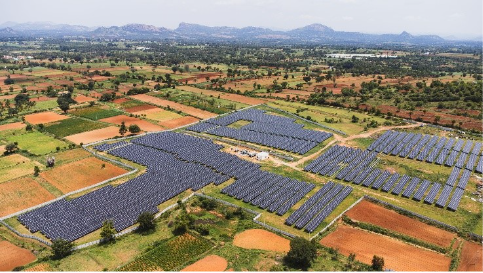
Renewable Investments: Almost 80% of this new capacity is slated to come from solar (279 GW) and wind (94 GW). As of 2026, installed solar capacity stands at 162 GW out of a total 548 GW. 2
India Peak Electricity Demand Trajectory
Industrial & Manufacturing Load
Data Centers & Digital Infrastructure
Green Hydrogen Electrolyzer Load
EV Charging & Urban Cooling Peak
All-India Peak Electricity Demand
Power Supply is Catching Pace, but Distribution is the Bottleneck
Generation targets are being met, but the grid infrastructure connecting that power to C&I hubs is buckling under the pressure of intermittent supply and skyrocketing peaks.
Power Demand vs. Generation: In September 2026, daily peak electricity demand spiked 45 to 50 GW higher than the previous year. Coal generation was forced up 13.3% to compensate for a 20% drop in hydropower. 3
Grid Instability Data: In Q1 2026, India lost 500 GWh of renewable electricity to curtailment. Recent data shows 68 major renewable grid disturbances, resulting in generation losses of up to 7 GW.
The Gap and Closure Methods: The primary bottleneck is intra-state evacuation networks. Closing this gap requires shifting focus to grid-scale flexibility, advanced forecasting, and integrating battery storage.
Generation Segment
Committed Investment
Lakh Cr (2025)
2035–36 Projected Capacity
Primary Authority Source and
Public: Private Investment split
Fossil Fuel
(Coal, Lignite & Gas)
₹6.5 – ₹7.2
~315 GW Coal
(+25 GW Gas)
Ministry of Power / CEA / ICRA
Public: Private ~70:30
Utility-Scale Solar Energy
₹10.5 – ₹12.0
~409 GW
CEA Adequacy Plan / MNRE / CRISIL
Public: Private ~80:20
MNRE National Green Hydrogen Mission
₹19,744 Cr Gov (SIGHT Scheme) + ₹8L Cr Private
(Reliance, L&T, Adani)
Nuclear Energy
(Large & Bharat SMRs)
₹2.2 – ₹2.8
~26 – 30 GW
Dept. of Atomic Energy / CEA
Central PSU (NPCIL / NTPC JV) + Private Captive SMRs
Total / System Aggregate
~₹34.0 – ₹40.0
1,121 GW
CEA Generation Adequacy Plan
(Incl. 174 GW / 888 GWh Storage)
Now this manifolds higher level of power generation will need to be transported to C&I users. This will need significant grid investment. To prevent grid lock, the CEA National Electricity Plan (Transmission) and CRISIL outline an urgent infrastructure overhaul. This will require investments across transmission, transformation, transfer and last mile distribution.
Transmission network for 220kV+ will need to move from ~4.85 lakh km to over 7.3 lakh km needing an investment of ₹9 lakh crore by 2035
Substations Transformation Capacity will need to double from 1250 GVA to 2850 GVA
Inter-Regional Transfer and Last Mile Distribution also need to double in this decade
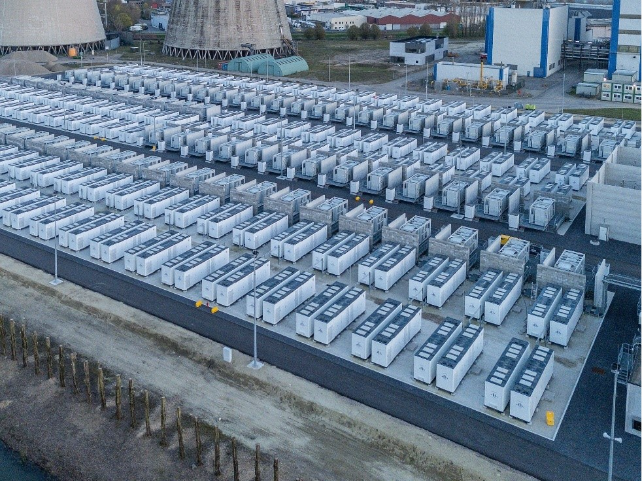
This means that storage is necessary for smoothening out the power generation and demand peaks, and the CEA Generation Adequacy Plan recommend s BESS capacity to go up from 5GW to 175GW in the coming 10 years.
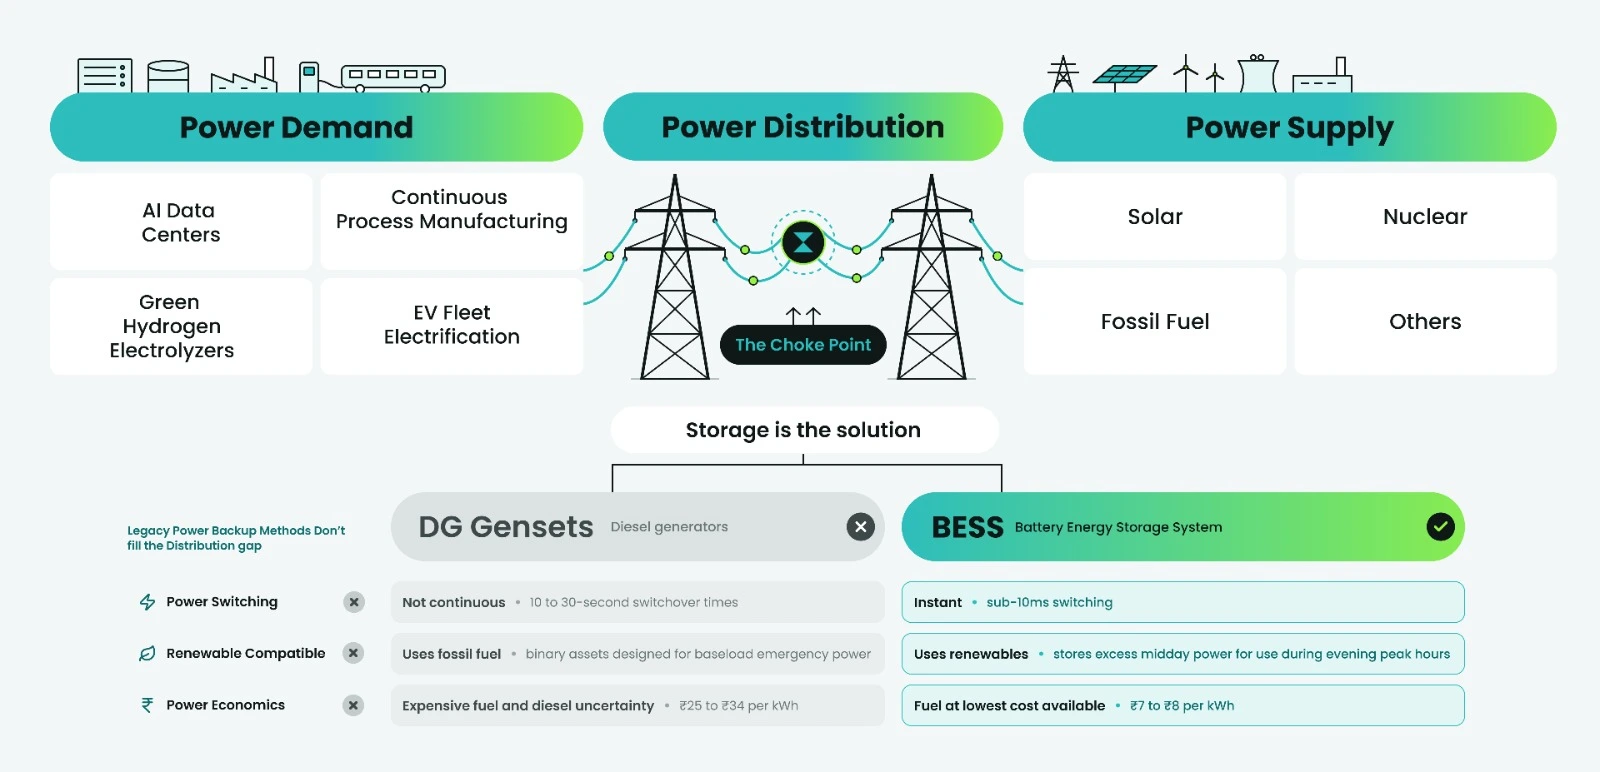
Legacy Power Backup Methods Don’t fill the Distribution gap
For decades, C&I facilities relied on diesel generators (DG) to bridge grid gaps. Today, that approach is financially and operationally unsustainable as the cost has gone up and is impacted n by multiple global situations – like the crisis in the Strait of Hormuz and Ukraine. Also, technically the delay of a few seconds in the switch over is very costly for process engineering and AI Data Centre’s as we saw with the opening example.
Diesel Economics: Running a diesel generator now costs roughly ₹25 to ₹34 per kWh. In contrast, charging a battery off-peak from the grid costs only ₹7 to ₹8 per kWh. 4
Poor Quality of Power Switching: Modern automation cannot tolerate the 10 to 30-second switchover times typical of diesel. These interruptions reset PLCs, costing manufacturers up to 1% of annual turnover.
Incompatibility with Renewables: Diesel generators cannot efficiently absorb or balance the intermittent spikes of a rooftop solar installation. They are binary assets designed for baseload emergency power.
Intelligent Storage and Energy Management Systems are Urgently Needed
Commercial and Industrial users want to drive energy independence and that is possible since energy generation is a nearly solved problem. Now all that is needed is energy storage. A Battery Energy Storage System (BESS) can easily help them move from a fossil fuel based near “100% emergency backup" to a sustainable uninterrupted power supply infrastructure.
Unlike traditional DG sets or basic inverters, an intelligent Battery Energy Storage System (BESS) actively manages facility power dynamics:
Diesel Replacement & Silent Backup: BESS provides zero-emission, silent power with sub-10ms switching that is completely invisible to sensitive industrial machinery.
Peak Shaving: By discharging during high-tariff periods or when the facility hits maximum kVA spikes, BESS eliminates monthly penalty surcharges from state electricity boards.
Renewable Integration: Storage smooths out solar generation. It stores excess midday power for use during evening peak hours, stabilizing supply without relying on the grid.
One spin. Explore solutions for a more resilient energy future.
YOUR NEXT DISCOVERY
Where could your power infrastructure improve?
Spin to explore critical power, battery storage,
data-centre backup and monitoring.
Critical Power
Battery Storage
Data Centres
Monitoring & Control
Four topics. Four ways to explore.
The real question is the Capital Expenditure required to setup this BESS infrastructure. So we have an indicative cost for a 2-Hour System — 400 kW / 800 kWh designed primarily for outage bridging and Time-of-Day (ToD) peak tariff shaving. The per-kWh cost is approximately ~₹25=30,000/kWh leading to a total CapEX of ~ ₹2-3 crore. Here is the indicative breakup:
Capex Component
2-Hour BESS (400 kW / 800 kWh)
Share (%)
Technical Role & Authority Benchmark
LFP Battery Racks & Modules (DC Block)
₹1,29,92,000 (₹16,240/kWh)
58%
Prismatic LFP cells (6,000–8,000 cycle life, 90% DoD).
Source: BNEF / JMK Research 2026 India C&I index.
Power Conversion System (PCS) & Static Transfer Switch (STS)
Basic Customs Duty (BCD) on imported cells, inland logistics,
and EPC commissioning.
Total Turnkey Installed Capex
₹2,24,00,000 (₹2.24 Cr) (₹28,000 / kWh)
100%
Aligned with 2026 India C&I BESS Market Benchmarks
(₹25k–₹32k/kWh)
The BESS Investment Pays-Off in a Few Years, and Drives Profitability
Replacing DG runtime with grid- or solar-charged battery storage yields a 70% to 77% reduction in backup energy costs. For a benchmark 500 kVA generator running 40 hours a month, switching to BESS saves an estimated ₹18 to ₹25 lakh annually on energy alone. Capital payback is typically achieved in just 2.5 to 3 years, transforming backup power from a sunk operational expense into a profit-generating asset over its 10-to-15-year lifecycle.
Explore the financial impact of replacing diesel generation with BESS for your facility using the interactive calculator below:
As India grows across sectors, AI Data Centers spawn and Electric Vehicles take the centre stage, Energy Demand will sky-rocket. Power generation is planning to catch up, but distribution will remain a key challenge. The solution for C&I operators is to invest in Battery Energy Storage Systems and to build a source of high-quality continuous power supply that creates much high long-term profitability by sourcing the power from renewable and efficient grid timing to create a supply that is both continuous and well-priced. With his investment operators can get better operational consistency and much higher profitability driven by better power economics.
500 kVA C&I BESS vs. Diesel Backup ROI
Compare 2-hour and 4-hour storage across diesel replacement
and daily solar arbitrage.
₹18.50/kWhBlended saving
Option A: 2-Hr (800 kWh)
Capex: ₹224 L (₹28k/kWh)
10-Yr Net Gain...
Break-Even...
Yr-1 Benefit...
10-Yr IRR...
Option B: 4-Hr (1,600 kWh)
Capex: ₹400 L (₹25k/kWh)
10-Yr Net Gain...
Break-Even...
Yr-1 Benefit...
10-Yr IRR...
Cumulative Net Cash Flow (₹ Lakhs)Year 0 capex outlay to Year 10
Illustrative inputs, not an investment forecast.
Savings per kWh are net of charging costs and conversion losses.
The slider allocates annual battery throughput between the two uses.
Annual cash flow = (energy savings + avoided process loss − O&M)
× (1 − tax rate) + depreciation tax shield.
WDV is applied to the full initial capex as a simplifying assumption.
Tax-shield use assumes sufficient taxable income.
Set tax to 0 for a pre-tax scenario.
Financing, replacement costs, escalation and residual value are
excluded. The same avoided process loss is applied to both options.
Illustrative estimates. Break-even uses cumulative cash flow.
Year-1 benefit is net cash flow. IRR uses the initial investment and
ten annual cash flows. Actual outcomes depend on site conditions.
Why do micro-outages hurt factories even in power-surplus states?
Lorem ipsum dolor sit amet, consectetur adipiscing elit, sed do eiusmod tempor incididunt ut labore et dolore magna aliqua. Ut enim ad minim veniam, quis nostrud exercitation ullamco laboris nisi ut aliquip ex ea commodo consequat. Duis aute irure dolor in reprehenderit in voluptate velit esse.
Generation capacity doesn’t guarantee steady supply when the grid lacks storage and last-mile distribution resilience. Diesel generators take 10 to 30 seconds to switch over. That delay can reset PLCs and halt processes. In one Gujarat example, an 18-second glitch ruined about ₹20 lakh of raw material and caused 14 hours of downtime.
How is a BESS different from a diesel generator for backup power?
Lorem ipsum dolor sit amet, consectetur adipiscing elit, sed do eiusmod tempor incididunt ut labore et dolore magna aliqua. Ut enim ad minim veniam, quis nostrud exercitation ullamco laboris nisi ut aliquip ex ea commodo consequat. Duis aute irure dolor in reprehenderit in voluptate velit esse.
A BESS switches in under 10 milliseconds, which sensitive machinery doesn’t notice. A diesel generator takes 10 to 30 seconds. Running a diesel generator costs roughly ₹25 to ₹34 per kWh, while charging a battery off-peak from the grid costs ₹7 to ₹8 per kWh. A BESS can also store and balance rooftop solar, which diesel generators cannot do efficiently.
How much does a C&I battery energy storage system cost in India?
Lorem ipsum dolor sit amet, consectetur adipiscing elit, sed do eiusmod tempor incididunt ut labore et dolore magna aliqua. Ut enim ad minim veniam, quis nostrud exercitation ullamco laboris nisi ut aliquip ex ea commodo consequat. Duis aute irure dolor in reprehenderit in voluptate velit esse.
An indicative 2-hour system rated 400 kW / 800 kWh costs about ₹2.24 crore turnkey, or around ₹28,000 per kWh. LFP battery racks and modules make up 58% of that cost. Power conversion and transfer switches are 16%, and controls, cooling and fire suppression are 12%.
How long does a BESS take to pay for itself?
Lorem ipsum dolor sit amet, consectetur adipiscing elit, sed do eiusmod tempor incididunt ut labore et dolore magna aliqua. Ut enim ad minim veniam, quis nostrud exercitation ullamco laboris nisi ut aliquip ex ea commodo consequat. Duis aute irure dolor in reprehenderit in voluptate velit esse.
Payback is typically 2.5 to 3 years. Replacing diesel runtime with grid- or solar-charged storage cuts backup energy costs by 70% to 77%. For a 500 kVA generator running 40 hours a month, the estimated saving is ₹18 to ₹25 lakh a year on energy alone, over a 10- to 15-year lifecycle.
Lorem ipsum dolor sit amet, consectetur adipiscing elit, sed do eiusmod tempor incididunt ut labore et dolore magna aliqua. Ut enim ad minim veniam, quis nostrud exercitation ullamco laboris nisi ut aliquip ex ea commodo consequat. Duis aute irure dolor in reprehenderit in voluptate velit esse.