



Demand Charges
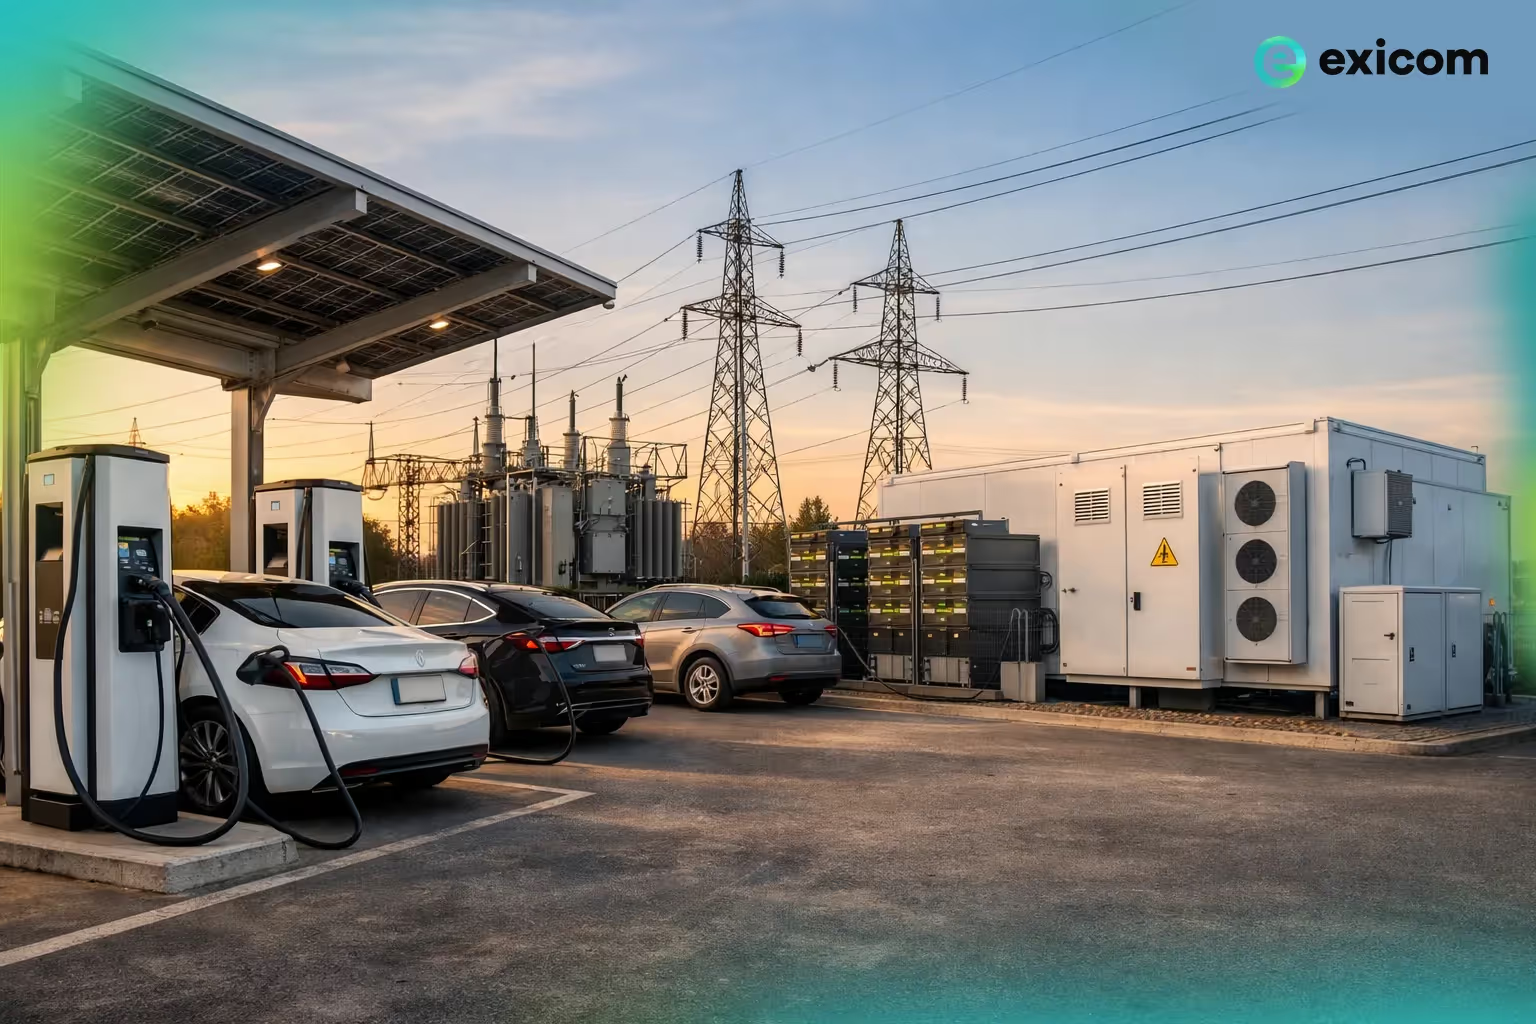
What is Demand Charges?
A demand charge is a commercial utility fee billed by electrical distribution companies based on the single highest peak of electrical power drawn over a specific, short interval (typically a rolling 15-minute window) within a billing cycle. Measured in kilowatts ($kW$), this fee is distinct from standard energy consumption charges (kilowatt-hours, or $kWh$) and directly recovers the utility's capital cost of maintaining grid equipment, transformers, and distribution lines sized to handle a facility’s absolute peak power surges.
Expanded Explanation of Demand Architecture
For enterprise facilities, fleet operators, and commercial real estate managers, electrical billing can be confusing when transitioning from domestic properties to commercial assets. Commercial power bills are structurally divided into two separate, independent pricing structures: volumetric consumption and peak structural capacity.
At a beginner level, consider a building's electrical setup to be like a commercial water plumbing infrastructure.
By opening a small tap for 100 hours, you'll consume a significant amount of water ($kWh$), but only require a narrow supply pipe ($kW$). Opening 50 heavy-duty faucets at the same time for merely 15 minutes uses the same volume of water, yet you would need a large, wide pipe to avoid system failure. The utility provider imposes a charge based on the diameter of that pipe. The demand charge rate is the structural capacity fee.
From a technical engineering standpoint, the surge in demand charge in EV charging systems arises directly from the swift shift to high-power DC fast chargers. When a business shifts from typical AC destination chargers (requiring between 7.4 kW to 22 kW) to high-speed DC charging units (requiring 60 kW, 120 kW, or 240 kW per unit), the local grid sees significant, instantaneous surges in current.
Although a 240 kW fast charger remains entirely unused for 29 days within the month, just one 15-minute charging session where a large logistics truck utilizes the entire 240 kW capacity secures that significant peak power benchmark. The utility provider determines your whole monthly charge from that one 15-minute peak, resulting in significant, unanticipated operational cost increases for operators without localized power buffer systems.
How Demand Fees Operate in Business Networks
Commercial facilities consist of three fundamental electrical hardware tiers that continuously engage to determine the rolling peak power metric:
- Substation Metering Interface: The utility's hardware layer tracking real-time current flow. It measures active apparent power draw continuously, averaging the total power pulled across successive rolling 15-minute intervals.
- Static Base Facility Load: The constant, predictable electricity drawn by everyday building operations, including large HVAC chillers, heavy manufacturing equipment, and safety illumination systems.
- Dynamic High-Amperage EV Load: The highly volatile power spikes introduced when multiple electric vehicles pull maximum current simultaneously from local dispensers.
- The Ratchet Peak Level: The highest aggregated power spike recorded by the system. Once logged, this threshold sets the structural baseline for the demand charge per kW calculation for that entire billing cycle.
Volumetric vs. Capacity Billing Models
Understanding the economic trade-offs between standard volumetric energy tracking and peak load capacity tracking is critical for minimizing infrastructure operations budgets.
Real-World Operational Profiles
- Consumers in Residential Complexes: Standard residential users rarely encounter these capacity fees directly on their private domestic meters. However, multi-family group housing societies running centralized parking infrastructure face capacity charges if multiple residents plug in heavy vehicles simultaneously, raising monthly maintenance allocations.
- Commercial Enterprises & Malls: Office parks and shopping environments feature massive base loads from central cooling plants. Introducing unmanaged daytime employee or visitor fast charging can push the property's total power consumption past its historical threshold, triggering significant utility billing penalties.
- Logistics Fleets & Infrastructure Providers: Fleet depots operate under tight delivery schedules where multiple delivery vans must top up quickly between shifts. Running several multi-gun DC fast chargers concurrently creates extreme capacity spikes, making up to 70% of a fleet's total utility bill consist of demand fees if unmitigated.
Data and Financial Infrastructure Metrics
Data compiled across commercial utility networks highlights how unmanaged fast-charging equipment alters real-world operational costs. The comparison matrix below models the impact of a dual-gun 120 kW DC fast-charging setup operating at different utilization profiles:
Impact of Utilization and Spikes on Site Cost Realities
Utility Frameworks
India's electric vehicle expansion requires navigating highly fragmented state-level distribution frameworks.
- Tariff Policies: State regulatory commissions handle demand fees differently. In Delhi and Maharashtra, state regulators have established promotional, dedicated EV charging tariff categories. These rules separate charging station connections from standard commercial slabs, offering reduced demand fees ranging from ₹100 to ₹200 per $kW$ to spur private infrastructure growth.
- Commercial Industrial Slabs: Operators running chargers on standard commercial and industrial (C&I) lines face standard infrastructure tariffs. In states like Karnataka and Tamil Nadu, standard industrial demand charges can range from ₹350 to ₹600 per $kW$ monthly. This structural cost makes careful power management essential for anyone starting a commercial charging business.
Enterprise Operational Scaling Strategies
- Fleet Operators: Transition from a "plug-in immediately" model to centralized orchestration. Utilizing fleet routing software allows scheduling vehicle charging in staggered groups throughout the night, ensuring total real-time capacity remains below critical limits.
- Charge Point Operators (CPOs): Build long-term profitability by avoiding low-turnover sites that risk high demand penalties. To maintain margins on highways with volatile traffic, CPOs deploy modular, split-power architectures that dynamically route energy between vehicles instead of allowing a single dispenser to spike the grid.
- Commercial Real Estate Managers: Maximize site capacity without expanding building power lines by deploying automated load management. These systems step down charger output automatically when primary building systems ,like central air conditioning—spike, keeping the facility safely under its legal maximum load.
Critical Capacity Challenges and Mitigations
Strategic Infrastructure Outlook
Managing peak power capacity is a defining factor in commercial charging profitability. Relying solely on raw utility grid connections exposes businesses to high peak demand charges that can impact site sustainability. By shifting toward integrated energy microgrids—combining local power generation, battery buffers, and smart distribution software, operators can break free from utility limits. These tools transform vehicle charging infrastructure into predictable, scalable, and highly profitable commercial nodes.

